2019 is definitely a good year for investors investing in REITS. Some REITS such as Mapletree Commercial Trust has already risen about 35% YTD and has been included as one of the components of STI Index. A look at REITS Data provided by The FifthPerson, you could see that there are a handful of big name REITS such as Ascendas Reit, CapitaMall Trust, Frasers Centrepoint Trust yielding less than 5% and some even yielding less than 4% like CapitaCommercial Trust, Mapletree Commercial Trust and Keppel DC Reit.
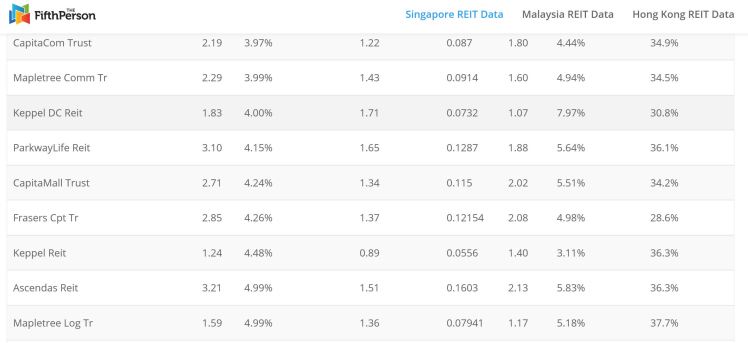
However, majority of the REITS listed in Singapore are still yielding more than 5%. I have picked a handful of REITS to analyse and will be posting the analysis in the next few weeks.
The REITS are:
- ESR Reit vs AIMS APAC Reit (AA Reit)
- Cromwell European Reit vs IREIT Global
- Keppel Pacific Oak US REIT (KORE), previously known as Keppel-KBS US REIT vs Manulife US Reit
Introduction to ESR Reit and AA Reit
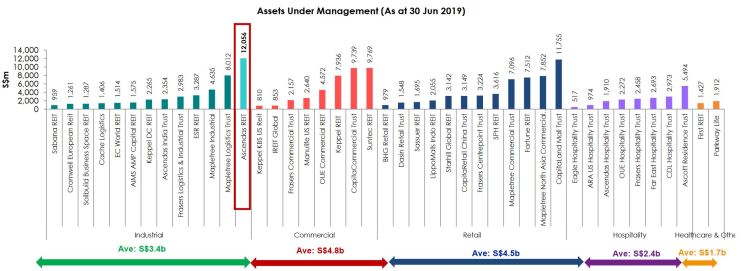
AREIT provided in its investor presentation a comparison of majority REITS’ Assets under Management (AUM) chart. Looking at the chart, we can see that ESR Reit is the fourth largest industrial REIT with more than $3 billion AUM while AA Reit owning more than $1.5 billion worth of industrial properties.

ESR Reit is an industrial real estate investment trust listed in Singapore. It owns 56 properties in Singapore, with a total gross floor area of approximately 14.0 million square feet and an aggregate property value of S$3.03 billion. ESR Reit owns Business Park, High-Specs Industrial, Logistics/Warehouse and General Industrial properties that are close to major transportation hubs and key industrial zones island-wide.
ESR is the sponsor for ESR Reit. ESR is a leading logistics real estate platform which owns properties in China, Japan, South Korea, Singapore, Australia and India with AUM exceeding US$20 billion and GFA exceeding 15 million square metres.
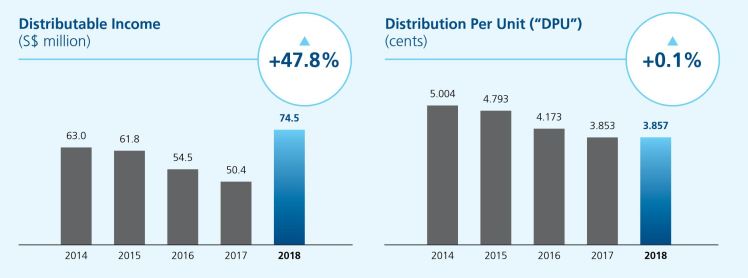
A look at ESR’s distributable income and DPU, you could see that that DPU has been sliding over the years and only managed to rebound in the latest financial year after merging with Viva Industrial Trust. Management attributed the decline in DPU and distributable income to conversion of STBs to MTBs. The conversion resulted in reduced revenue and increased property expenses. Single Tenanted buildings results in longer WALE thus generating yield stability. However, since STBs are signed for a long period of time, ESR Reit might miss out on the higher rental rates when demand for industrial space is more than the supply provided. Therefore, ESR Reit has embarked on a STB to MTB conversion strategy to ensure flexibility to capture potential rental upside in an increasingly stabilised supply environment. Based on rental income as at 31 December 2018, 30.5% of the portfolio comprises STB while the remaining 69.5% accounts for MTB.
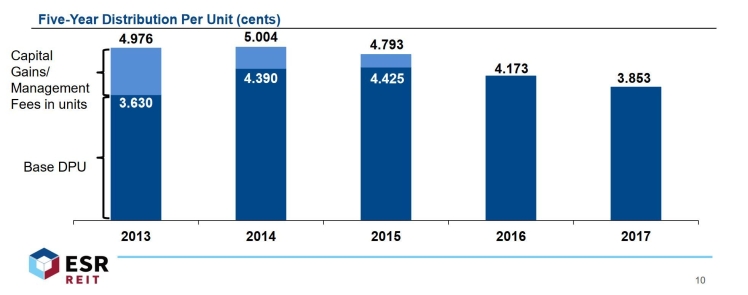
In addition, the decline in DPU can also be attributed to management decision to cease topping up its DPU using capital gains or management fees in units. Looking at it in another perspective, the drop in DPU is not really that significant after taking into account the omission of capital gains distribution.
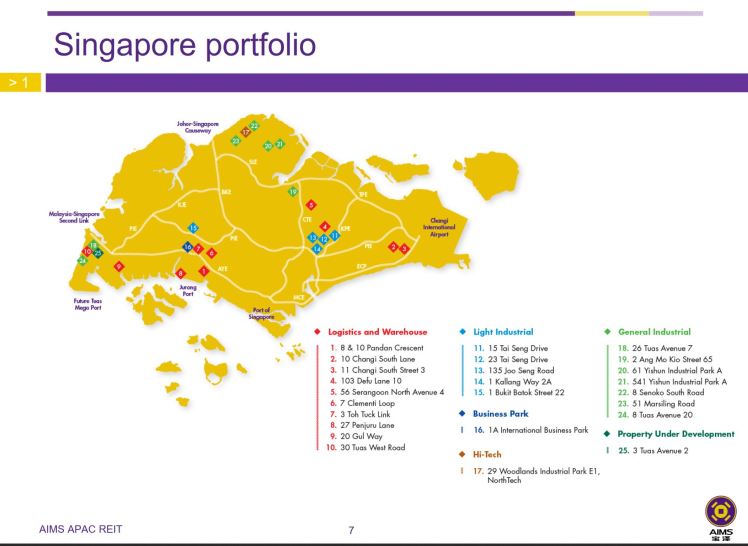
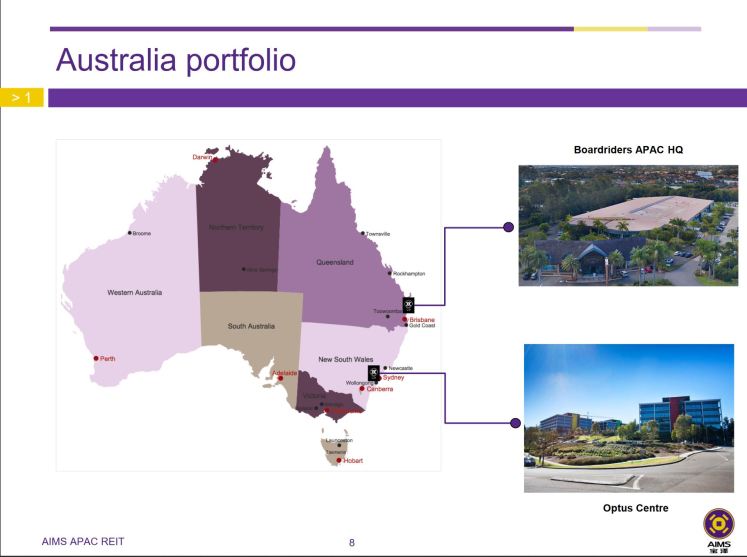
AA Reit is an industrial real estate investment trust listed in Singapore. It owns 25 properties in Singapore and 2 properties in Australia, with a total gross floor area of approximately 7 million square feet and an aggregate property value of S$1.5 billion. AA Reit owns Business Park, Hi-Tech Industrial, Light Industrial, Logistics/Warehouse and General Industrial properties.
AIMS Financial Group is a diversified financial services and investment group, active in the areas of mortgage lending, securitisation, investment banking, funds management, property investment, private equity, venture capital, stock broking and high-tech investment.If I understand the company correctly, AIMS Financial Group is not a property developer. so for AIMS APAC Reit to grow inorganically, it has to source for third party properties. Just comparing the sponsor alone, investors would be better off investing in ESR Reit as its sponsor is a developer similar to Ascendas Singbridge and Mapletree so for it to grow inorganically, it is able to acquire ROFR properties from its sponsor. In summary, it is also means that the growth story of ESR Reit is much brighter and clearer than that of AA Reit.
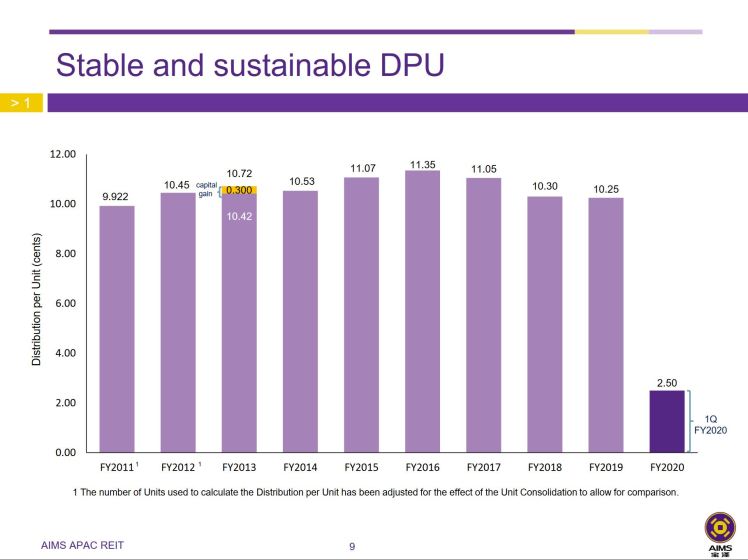
AA Reit Distribution per unit hasn’t been growing after it has reached its peak in FY2016. The drop in DPU can be attributed to the larger unit base following the private placement in December 2017.
Portfolio Overview
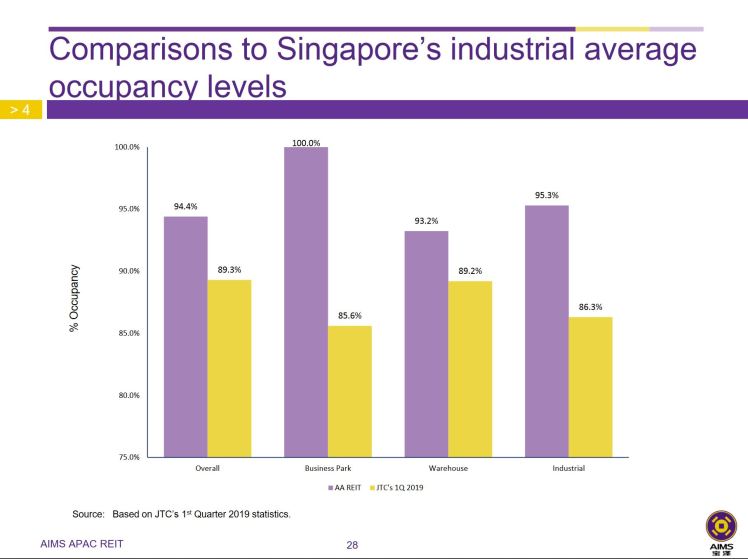
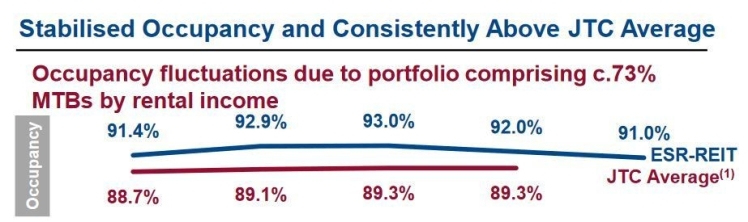
AA Reit’s overall occupancy rate in Singapore stands at 94.4% while ESR Reit’s figure is at 91%. Both Reits overall occupancy rates are above JTC average of 89.3% as of 1Q2019. Only AA Reit provides a chart that compares its occupancy rate based on the type of industrial properties against JTC average. AA Reit occupancy rate is higher than the industrial average across the board.
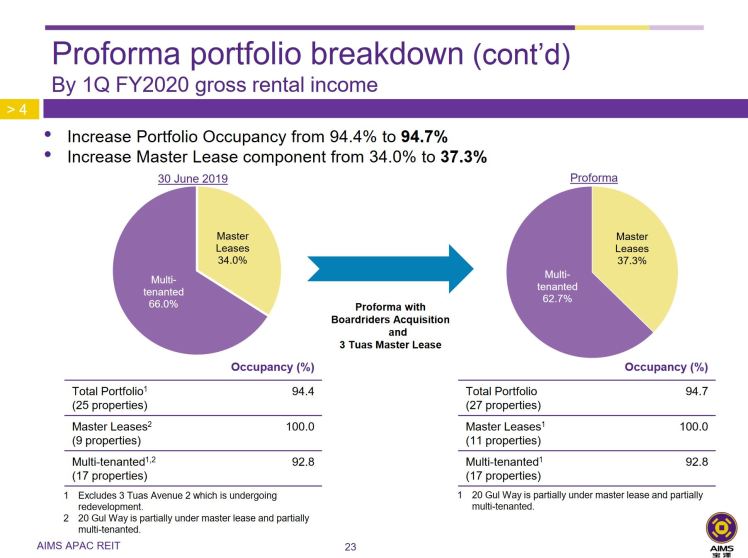
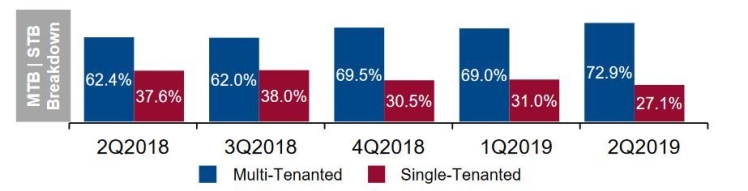
Taking a look at MTB and STB breakdown, we could see that ESR Reit has higher MTB than AIMS APAC Reit at 72.9% for the former and 62.7% for the latter. To simply explain, Single Tenanted Buildings will result in the WALE to increase as leases are signed for a longer period of time and large space. Due to this, reit manager might miss out on higher rental rates when demand for industrial space is more than supply provided. To circumvent this problem, STB has in-build rental escalation to overcome or offset the risk in case there is a sudden increase in rental rates. Whether the rental escalation can help offset fully is a question. Therefore, many reit manager decided to convert its building to MTB from STB to ensure flexibility to capture potential rental upside in an increasingly stabilised supply environment.
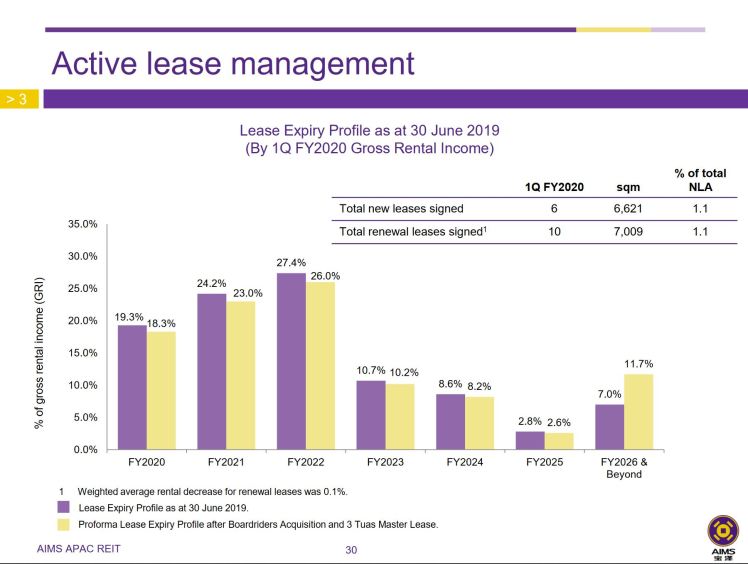
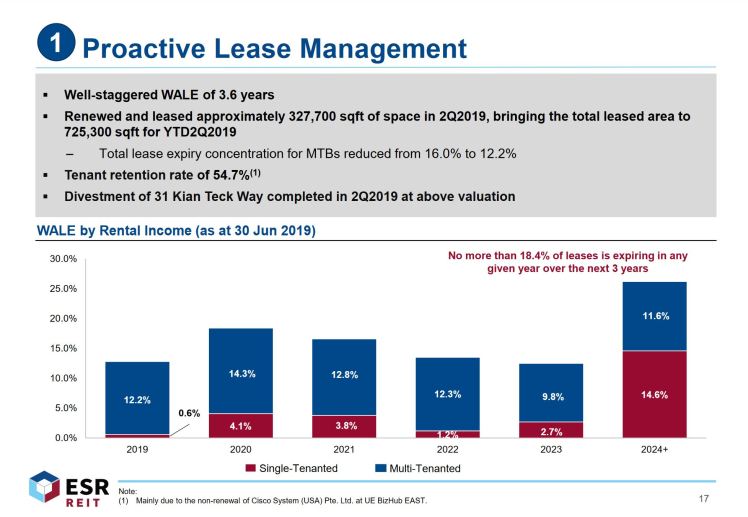
Only looking at the statistics for the next three years, we could see that expiring leases by gross rental income is lower for ESR Reit. Take for example, 12.8% of leases will expire in 2019 for ESR Reit compared to AA Reit’s 18.3%. In summary, 47.8% of leases in ESR Reit will expire in the next three years compared to 67.3% in AA Reit. If given a choice between ESR Reit and AA Reit based on expiring leases, I would choose ESR Reit. This is because there are fewer leases that are going to expire in the next three years compared to AA Reit thus making ESR Reit more stable.
In addition, WALE for ESR Reit’s portfolio is 3.6 years which is higher than AA Reit’s 2.38 years. I am a fan of higher WALE as having higher WALE means that the management does not need to find tenants thus providing stability in rental income. However, the con of having a longer WALE is that if the REIT will miss out any opportunity of rising market rental rates unless there are rental review in the lease.
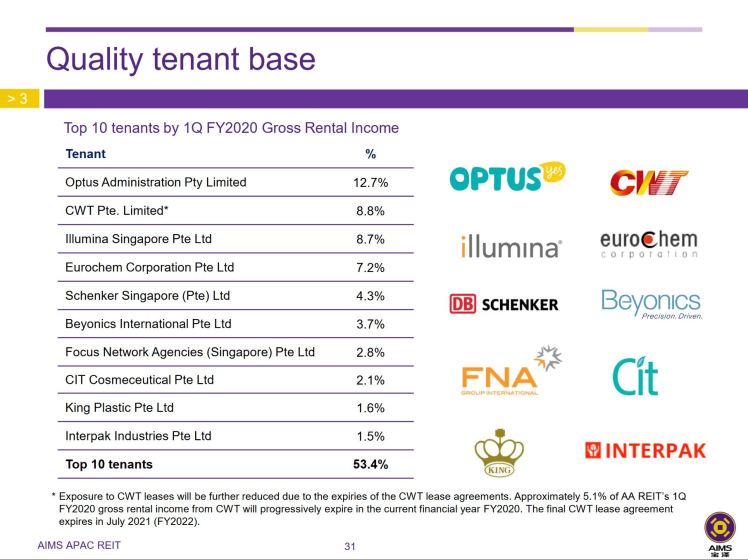
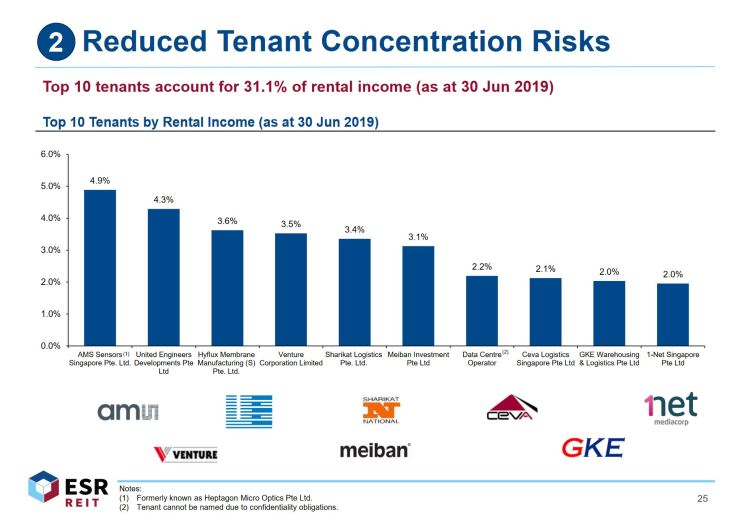
ESR Reit has over 329 tenants while AA REIT has about 169 tenants. AA Reit has key tenant risk as its top tenant – Optus contributes close to 13% of gross rental income. On the other hand, AREIT top tenant – AMS Sensors contributes 4.9% of gross rental income. Due to the high contribution rate from AA Reit, ESR Reit’s Top 10 tenants contributes 31.1% compared to 53.4% in AA Reit.
I feel that it is extremely risky to invest in AA Reit as 53% of its rental income comes from 10 tenants. Imagine a black swan event happened resulting in top 10 tenants from both ESR Reit and AA Reit to be wiped out, more than 50% of rental income from AA Reit will be affected compared to the 31% from ESR Reit.
Debt
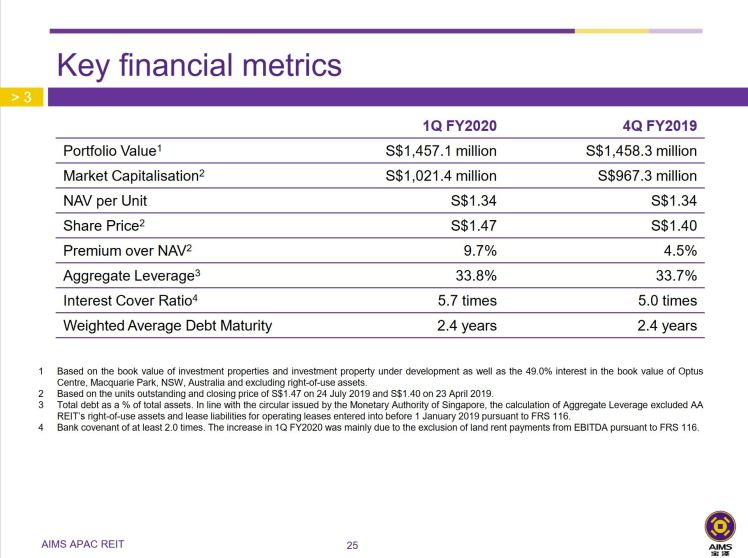
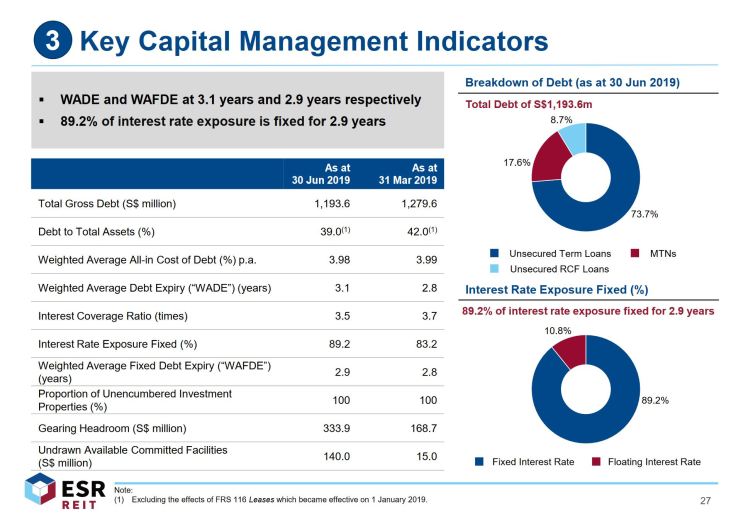
In this section, we will take a look at the financial health of the REITs. Debt is very important for REITS and investors as this is one of the few methods that REITS finance to acquire properties. We will look into the Gearing Ratio and Interest Coverage Ratio. Gearing Ratio of ESR Reit stands at 39% while AA Reit is at 33.8%. A lower gearing ratio will be preferred in this case. As for Interest Coverage Ratio, AA Reit has higher figure at 5.7x while ESR Reit is at 3.5x. Interest Coverage Ratio means how much times its EBIT can cover the Interest Expense. It also determines how easily a company can pay interest on its outstanding debts. Therefore, a higher Interest Coverage Ratio will be preferred. With that being said, we shall look into the funding cost for both REITS. Funding cost for ESR Reit stands at 3.98% while AA Reit’s figure stands at 3.6%.
If ESR Reit and AA Reit were researched last year, a higher percentage of debts on fixed rates will be preferred as cutting of interest rate was only announced in 2019. ESR Reit fixed interest rate stands at 89.2% while AA Reit figure stands at 80.9% In this rising interest rate environment, it will be wise to select REITS that have higher percentage of debts on fixed rates. When debts are fixed rate, it means that the management has already hedged its interest rate and REITS will not be affected by any rising interest rate. However, with the recent announcement by the Federal Reserve cutting interest rates, a lower percentage of debts on fixed rates will be preferred as REITs will be paying more interest since majority of its loans are on fixed rates thus reducing its distributable income to unitholders.
Comparing it with AREIT and MIT
|
Ascendas Reit |
Mapletree Industrial Trust |
ESR Reit |
AIMS APAC Reit |
|
| Sponsor | Ascendas Singbridge – member of CapitaLand | Mapletree Investments | ESR | AIMS Financial Group |
| Properties | 171 | 101 | 56 | 27 |
| AUM | > $11 billion | $4.8 billion | $3.03 billion | $1.5 billion |
| Occupancy Rate | 91.1% (Overall) | 90.5% (Singapore)
97.4% (US) |
91% | 94.4% |
| Lease Expiry/ WALE | 4.1 years | 3.4 years | 3.6 years | 2.38 years |
| Top 10 Tenants | 19.3% | 25.3% | 31.1% | 53.4% |
| Gearing Ratio | 37.2% | 33.4% | 39% | 33.8% |
| Interest Coverage | 5x | 6.6x | 3.5x | 5.7x |
| Fixed Rate | 73.5% | 79.5% | 89.2% | 80.9% |
| Weighted Debt Maturity | 3.8 years | 4.2 years | 3.1 years | 2.4 years |
| Funding Cost | 3% | 3% | 3.98% | 3.6% |
I have compiled a list of factors that are worth to compare when it comes to investing in REITS. The first thing we look at will be sponsor. Both AREIT and MIT have strong sponsors. Ascendas Singbridge, a wholly owned subsidiary of CapitaLand, owns 19% of AREIT, is a leading sustainable urban development and business space solutions provider. Mapletree Investments Pte Ltd is the sponsor for Mapletree REITS. Mapletree Investments was established in 2000 after Port of Singapore Authority (PSA) transferred non-port properties to Temasek. There is no need to compare when it comes to sponsor because the sponsors from AREIT and MIT are much well established and well-known than sponsors especially from AA Reit. At the very least, the sponsor from ESR Reit develops logistics properties so ESR Reit can tap on it for future growth. Next, we look at the number of properties and the AUM each REITs own. Again, there is nothing much to compare as AREIT and MIT are bigger industrial REIT than ESR Reit and AA Reit. Thanks to the merger with Viva Reit, ESR Reit is now fighting with FLT for third largest industrial REIT.
Interestingly, AA Reit performs well in terms of occupancy rate at 94.4% while the other three REITS’ occupancy rate stands at around 90%. WALE is tricky as investor has different preferences. Some investors might like a shorter WALE if the industry is doing well or vice versa. AA Reit has the lowest WALE at 2.38 years while AREIT offers the longest WALE at 4.1 years. As mentioned earlier, I prefer a longer WALE because management does not need to find tenants thus providing stability in rental income. However, the con of having a longer WALE is that if the REIT will miss out any opportunity of rising market rental rates unless there are rental review in the lease. The more properties the REIT owns, the lower the percentage of Top 10 tenants contributing to the rental income and this is true in our comparison. The largest industrial REIT- AREIT’s top 10 tenants contribute 19% of its rental income while AA Reit’s top 10 tenants contribute 53% of rental income.
I feel that AA Reit is more disciplined while ESR Reit is more aggressive when it comes to managing its debt. From the table, you could see that the gearing ratio of AA Reit is one of the lowest among the four REIT and that the interest coverage is one of the highest. It is worthy to note that AA Reit’s weighted debt maturity is the lowest at 2.4 years. In this low interest rate environment, the management can refinance the debt with a lower interest rate thus reducing the funding cost. However, this will mean more stress for management and unitholders as bulk of its loan require need to refinance. Lastly, funding cost, it is something we can’t compare much as AREIT and MIT are larger industrial REITs which are well known and established compared to the other two REITs. Banks are willing to give lower interest rate as the credit and default risk are lower than a smaller REITs like ESR Reit and AA Reit.
Closing Thoughts
I still feel that ESR Reit is a better buy than AA Reit all long even before doing any research on them. In my opinion, the merger of ESR Reit with Viva Industrial Reit was an excellent move to bring ESR Reit to another level. As what the management from ESR Reit has mentioned – Size is a competitive advantage for REITS. With this merger, ESR Reit is able to reposition our assets and carry out enhancements, upgrades and revitalization to take on the next stage of growth. On the other hand, I do not see a clear plan of how the management of AA Reit can continue to deliver growth in distribution besides organic growth through asset enhancement initiative. If you are someone who prefers a management to be disciplined with its financial and debts, AA Reit will be your preferred choice. If you believe that the underlying assets of the REIT is the only main drive of growth then ESR Reit will be your preferred choice. That being said, if there is an opportunity to buy into one of the REITs, I will choose ESR Reit.


3.x ICR is risky. Any movement in Interest rates will be bad for earning. There aren’t much room to move other than right issues which likely diluting. However gearing of ESR is quite high. …. I think this problem beats all matrix. Time bomb ?
LikeLike
Want to add it can be interests movement or business rental condition. The path is very tight.
LikeLike
I’ve learned newer and more effective things by means of your site. One other thing I’d prefer to say is that newer computer system operating systems are likely to allow much more memory to get used, but they furthermore demand more memory simply to perform. If a person’s computer is unable to handle a lot more memory as well as newest software requires that storage increase, it can be the time to shop for a new Computer system. Thanks
LikeLike